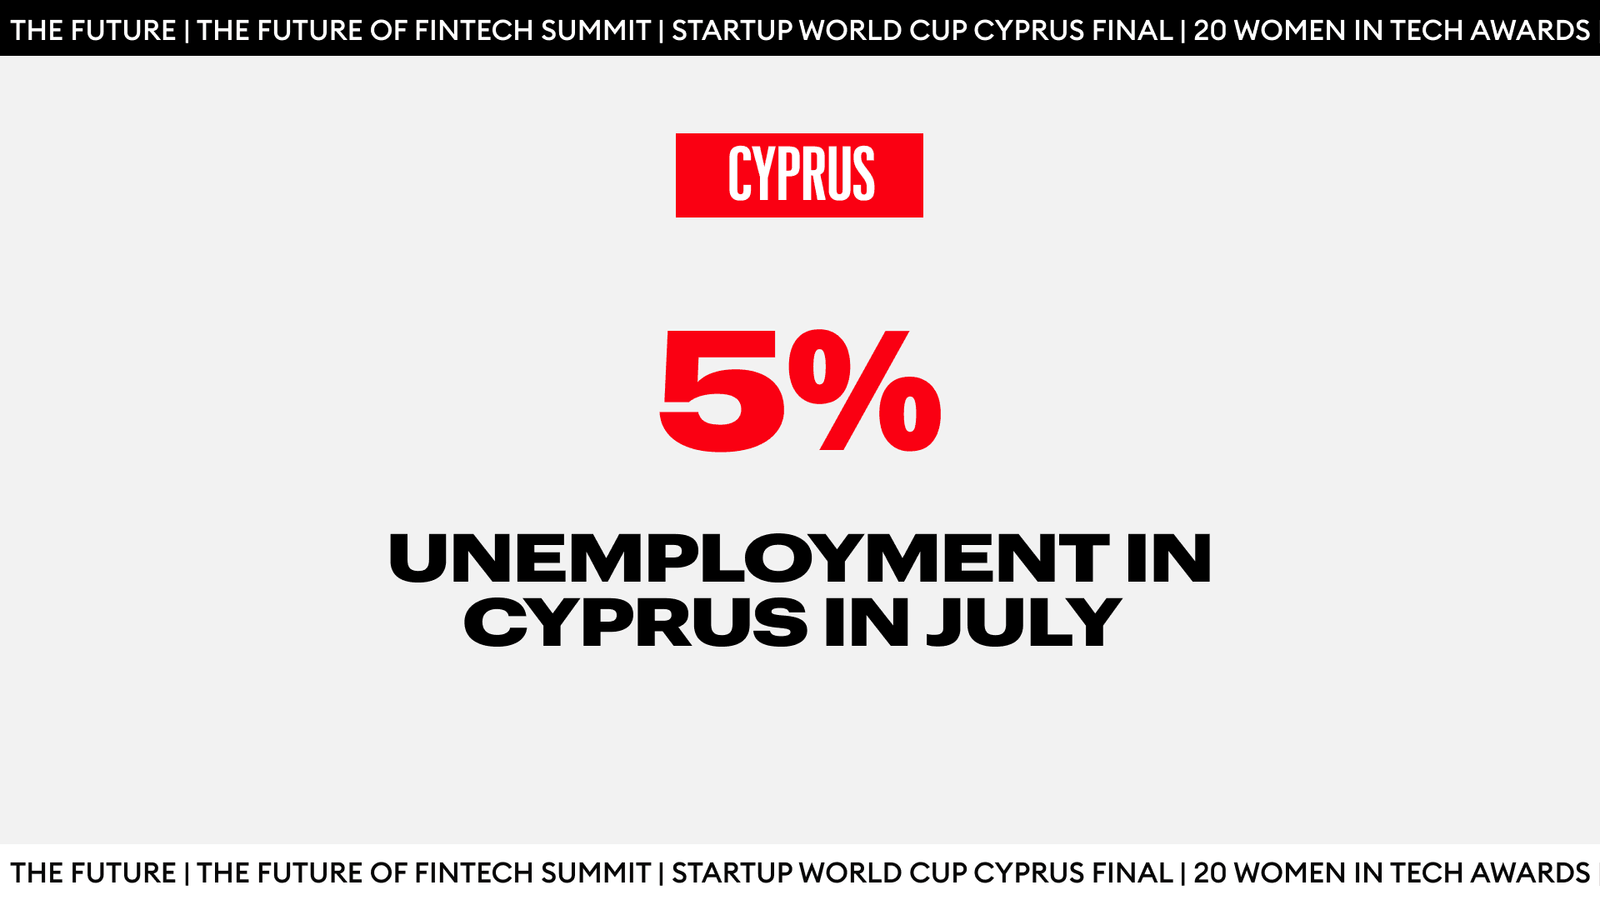
Cyprus unemployment rose to 5.0% in July 2025 from 4.7% in June, according to Eurostat. That remains below the EU’s 5.9% and the euro area’s 6.2%, keeping Cyprus ahead of the bloc average.
Why does Eurostat show 5.0% and the national release shows 4.3%
CyStat released its Labour Force Survey for Q2 2025 on August 28, reporting a quarterly average unemployment rate of 4.3%, which translates to 22,663 people, for the period from April to June. Eurostat’s 5.0% is a separate, monthly estimate for July 2025, published on September 1 as part of its EU-wide unemployment release.
Follow THE FUTURE on LinkedIn, Facebook, Instagram, X and Telegram
How to read these variables, mainly by considering the timing and method of collection:
- Timing: The national figure is a quarterly average that ends in June. Eurostat’s number is for the following month, July, when the rate increased from 4.7% to 5.0% on the EU-comparable series.
- Method: Eurostat publishes a seasonally adjusted, EU-comparable monthly series designed to line up countries on the same basis. CyStat’s 4.3% reflects the quarterly Labour Force Survey for Cyprus. The Labour Force Survey (LFS) asks households about a specific reference week. A person counts as unemployed if they had no paid work, were available to start within two weeks, and actively looked for a job (ILO definition). The rate is unemployed people divided by the labour force (employed + unemployed). The 4.3% is the average of April, May and June responses, weighted to the national population. It smooths month-to-month bumps and gives a clean read on the spring quarter.
Both figures are valuable for different purposes. The Eurostat monthly rate compares Cyprus with the EU and tracks turning points between quarters. The CyStat quarterly rate compares local trends within the spring–summer period.
July results and the hiring outlook
Cyprus’s unemployment rate rose to 5.0% in July from 4.7% in June, equivalent to about 27,000 people out of work versus 25,000 a month earlier. In the same month, EU unemployment fell to 5.9% and the euro area to 6.2%, so Cyprus moved against the bloc’s direction while still performing better than the EU average.
Here are three reasons that may explain the move without over-reading one month of data:
- Small-market effect. Cyprus is a small labour market. A change of about two thousand people can move the rate by 0.3 percentage points month over month. That variation is normal and often temporary.
- Labour demand remains high in key services. The latest national release shows 16,053 vacancies in Q2 2025 and a 3.3% job vacancy rate, with the highest pressure in accommodation and food services (6.6%), arts and recreation (4.7%), and administrative and support (4.0%). High vacancies alongside a higher unemployment rate suggest a mismatch rather than a decrease in demand.
- Pay is rising, but not evenly. The Labour Cost Index increased 4.1% year over year in Q2 2025 (wages and salaries by +4.2%). That is consistent with tighter hiring conditions in parts of the economy, even as some households still face cost-of-living pressure.
Employers should treat July as a reminder to check their pipelines, though this is not a reason to pause hiring. Filling roles will still take longer and may require wider sourcing, potentially from outside of the borders, or targeted upskilling of current employees.
Cyprus compared to other EU countries
Eurostat’s July result places Cyprus at 5.0%, below the EU average of 5.9% and the euro area’s 6.2%. Altogether, Eurostat estimated that 13 million people were unemployed in the EU, including 10.8 million in the euro area.
At the country level, Cyprus sits well under the rates reported in several northern and southern peers. Spain topped the EU table at about 10.4% in July. Finland was also higher, at 9.9% and 8.9% respectively. By contrast, large economies such as Italy came in close to Cyprus, at 6.0%.
Final Thoughts
Cyprus ends July with unemployment at 5.0%, higher than June, yet still below the EU’s 5.9% and the euro area’s 6.2%.
What executives can do now:
- Prioritise roles under strain. Expect longer time-to-fill in service functions in the tourism and service sectors. Start requisitions earlier and simplify approvals so offers go out faster.
- Target pay. Use focused adjustments and retention incentives in hard-to-staff roles instead of across-the-board increases. Tie packages to performance and scarce skills.
- Widen the funnel. Look for alternative sourcing pathways beyond the local market and invest in short, job-ready training for entry-level service roles. For tech and professional services, build internship and conversion pipelines ahead of Q1–Q2 2026.
- Plan around seasonality. Align hiring calendars with peak periods in hospitality and service. Where feasible, convert repeat seasonal roles to multi-season contracts to reduce annual restart costs.
If August stabilises and vacancies remain high in services while the tech sector remains near 2.9%, the case strengthens for a tight market with mismatches. If unemployment continues to rise and vacancies ease, adjust hiring plans and assumptions for a cooler autumn.


